FIGURE 1
How Long Have I Had My Cancer, Doctor?
“How long have I had this cancer, Doctor?” This is a question that patients frequently ask their oncologist.
To estimate the “age” of cancers at the time of diagnosis, we reviewed data on the “time to local/regional recurrence” (LRF) following initial surgical resection for three common cancers, then applied a modified version of Collins’ law. We conducted a systematic review of English medical literature to identify studies reporting LRF rates, over time, following surgery alone for breast, lung, or colorectal cancer. Patients who received radiation/hormones/chemotherapy were excluded since these therapies may alter tumor growth kinetics after surgery. For each disease, data were considered in three ways: 1) absolute cumulative LRF rate over time; 2) percentage of LRFs manifest over time (to facilitate comparisons between studies with different absolute magnitudes of LRFs); and 3) weighted average of the percentage of LRFs manifest over time.
For breast cancer (based on data from 3,043 patients from 5 studies), we found that the median time to LRF was 2.7 years. For lung cancer (based on data from 1,190 patients from 4 studies), the median time to LRF was 1.5 years. For rectal cancer (based on data from 3,334 patients from 10 studies), the median time to LRF was 1.5 years. Based on Collins’ law, the distribution of time to LRF suggests that the age of most of the solid tumors studied was 3 to 6 years.
“How long have I had this cancer, Doctor?” This is a question that patients frequently ask their oncologist. In many instances, the answer to the question is not particularly relevant since treatment approaches may not be influenced by the “age” of the cancer. However, in some instances the age of a cancer, which implies its natural history, may influence treatment recommendations.
In addition, the answer to this question may have helpful implications for our patients. When patients are diagnosed with cancer, they often seek to understand “why.” They search for particular events in their lives that may have “caused” the cancer to form. A better understanding of the likely age of their cancer may address misconceptions about the “causes” of their cancer and help to alleviate associated guilt (eg, “Did I cause my cancer by working too hard last month?” “No, because the cancer started to grow at least 2 years ago.”).[1-4] Also, some understanding of their cancer’s age may help to alleviate patients’ concerns regarding any delays in treatment (ie, they will be less concerned about a modest delay if they understand that the tumor has been present for a long time).
In 1955, Collins et al attempted to develop a method of measuring the growth rate of tumors. They hypothesized that if the change in tumor volume were known for a given time interval, the average growth rate could be calculated and used to estimate the time of inception for a given tumor[5]. Collins studied the interval between surgery and recurrence in patients with Wilms tumor. In a graph (see Appendix) that compared the patients’ age at diagnosis to their age at follow up, he noted that all local recurrences occurred at time intervals that were shorter than the patients’ “gestational age” (ie, their age plus 9 months) at diagnosis. This is consistent with the fact that the tumor’s “maximum age” at the time of diagnosis could be no greater than the child’s age plus 9 months. Thus, a patient whose tumor is resected at the age of 3 can be considered cured when he or she reaches the age of 6 years and 9 months. This concept, known as the period of risk for recurrence, later became known as Collins’ law.[6] Other investigators have confirmed the accuracy of Collins’ law in patients with medulloblastoma and Wilms tumor.[6-10]
To address the question “how long have I had my cancer?” we used a modified version of Collins’ law. We reviewed the reported pace of local relapse following definitive local therapy as a means of estimating the age of the initial tumor at diagnosis. We hypothesize that the time of inception for various tumors might be estimated by quantifying the interval between gross total resection and time to local failure.
Methods
Assuming that the growth rate of a tumor is constant before diagnosis and after surgery (but before a local recurrence), one can use the time to local recurrence to estimate the tumor’s age. Figure 1 shows the rationale for this claim. The solid red and dotted green lines represent two scenarios. The solid line represents the situation in which only one tumor cell remains in the patient following surgery, and the dotted line represents that in which there are multiple remaining tumor cells. If more cells remain in the patient, the cancer will recur faster, thereby reducing the time to local recurrence. A group of patients who experience a local recurrence after surgery likely reflect diversity in the number of cells remaining in the post-operative tumor bed. At one extreme, the patients with the longest interval between surgery and local recurrence probably had the smallest number of residual tumor cells in the surgical bed, and their time to local failure may represent the time it takes for a small number of cancer cells to grow to a clinically evident size-which in turn might reflect the age of such cancers at diagnosis.

Idealized Graph Relating Tumor Growth Kinetics to the Clinical Appearance of a Cancer
FIGURE 2A
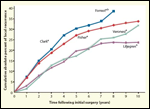
The Cumulative Absolute Percent of Local Recurrences as a Function of Time Following Initial Surgery, for Series of Patients with Breast Cancer
FIGURE 2B
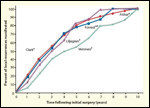
The Percent of Local Recurrences Manifested as a Function of Time Following Initial Surgery, for Series of Patients with Breast Cancer
FIGURE 3A
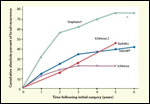
The Cumulative Absolute Percent of Local Recurrences as a Function of Time Following Initial Surgery, for Series of Patients with Lung Cancer
FIGURE 3B
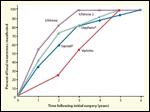
The Percent of Local Recurrences Manifested as a Function of Time Following Initial Surgery, for Series of Patients with Lung Cancer
For this analysis, we conducted a systematic review of the literature to identify studies that reported a time to local recurrence for various tumors. The search was conducted through several databases, including PubMed, Ovid Medline, and Elsevier, for the years 1956 to 2008, inclusive. The systematic review was focused primarily on the identification of prospective randomized controlled trials published in English in which one of the study arms was surgery alone. Prospective trials were preferred since in this type of study patients typically have regular follow-up evaluations and data collection is fairly consistent. In some instances in which there were limited prospective data, large retrospective studies were also included. In all instances, only studies that reported the rates of local failure over time were included. In some settings, the data were reported as local (+/– regional).
The systematic review involved adult patients with a clinical diagnosis of breast, lung, or rectal cancer. These cancers were chosen based on their prevalence in the population. Data were extracted from patients treated only with surgery, in order to avoid the confounding effects of radiation, hormonal therapy, or chemotherapy. These therapies may alter the growth kinetics of the tumor after initial surgery.
Data were obtained either from statistics listed in the studies or from graphs within the studies. If a graph was used to obtain data, simple measurements with a digital ruler were used to approximate data points (ie, the rates of local failure over time). After collection, the data were compiled into separate graphs for each of the tumor types. After all tumor types were graphed, the weighted average was calculated for each tumor type, with weight added to the studies with larger cohorts.
Data were considered in several ways. First, the absolute cumulative rate of LRF over time was considered. Second, in order to facilitate comparisons between studies, the data were considered as the percents of the LRFs that had manifested over time. With this approach, we were able to compare the distribution of “time to LRF” between studies even if the absolute magnitude of the LRF rate was different between studies. Third, for each disease site, the percent of the LRFs that had manifested over time was averaged from the individual studies. This average was weighted based on the total number of patients with an LRF from the study. The details are given below.
Absolute cumulative rates of LRF over time
For each article considered, the absolute cumulative rate of LRF, at various time intervals, was extracted from the report. Evaluable studies had to associate an LRF rate with a specific post-surgery time interval. In most of the studies, the LRF rates were recorded annually in the form of text, tables, or graphs. We plotted the data against time using Microsoft Excel in order to recreate the graphs from the published studies, as seen in Figures 2A, 3A, and 4A.
Computing the percent of LRFs manifest over time
The maximum reported cumulative LRF rate was noted (essentially that at the longest post-surgery time point with an associated LRF rate). At each time point, the percent of LRFs manifest by that time was calculated (ie, reported LRF rate / maximum LRF rate). This approach essentially renormalized each of the individual cumulative failure rate graphs to a maximum of 100% (Figures 2B, 3B, 4B).
Averaging data from different studies
The “percent of LRFs manifest over time” data from the multiple studies for each cancer type were averaged. The average was weighted based on the total number of patients with an LRF in each study. For a given year, the cumulative percent of LRFs for a given study was multiplied by the number of patients with an LRF in that study, and the sum of the products from the various studies was divided by the sum of all the patients with an LRF in those studies.
The articles considered for the different diseases are summarized in Tables 1-3.
Results
The absolute rates of LRF for patients with breast, lung, and rectal cancers are shown in Figures 2A, 3A, and 4A. Graphs illustrating the percent of LRFs manifest over time are shown in Figures 2B, 3B, and 4B. Note that the curves in Figures 2B, 3B, and 4B all reach 100%. The weighted averages for the data from the different diseases are shown in Figure 5.
Discussion
TABLES 1–3
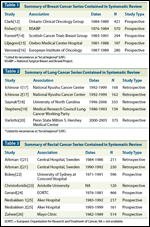
Summaries of Breast, Lung, and Rectal Cancer Series Contained in Systematic Reviews
FIGURE 4A
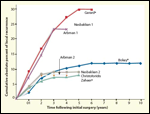
The Cumulative Absolute Percent of Local Recurrence as a Function of Time Following Initial Surgery, for Series of Patients With Rectal Cancer
FIGURE 4B
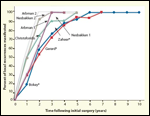
The Percent of Local Recurrences Manifested as a Function of Time Following Initial Surgery, for Series of Patients with Rectal Cancer
FIGURE 5
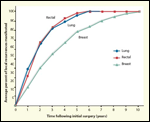
The Weighted Average, for All Cancer Types, of the Percent of Local Recurrences Manifested as a Function of Time Following Initial Surgery
This analysis suggests that most LRFs for breast cancer occur in the range of 1 to 5 years post-surgery, and that the maximum time to LRF is usually in the range of 5 to 6 years. For lung and rectal cancer, most LRFs occur in the range of 1 to 3 years post-surgery, with a maximum time to LRF of ≈ 3 to 4 years. Using Collins’ law, one would then conclude that the age of most cancers at the time of diagnosis is in the range of 3 to 6 years. The LRFs occurring at shorter time intervals might result from patients with disease burdens greater than one cell after surgery.
This analysis is idealized, and several shortcomings arise from the underlying assumptions. First, it is assumed that the tumor growth rates before diagnosis and after resection are relatively similar. Based on the initial work by Collins, and subsequent work by Brown, Paulino, Sala, and others, this might be a reasonable assumption.[6-11] Nevertheless, changes in the regional physiology (eg, vasculature or immunologic status) induced by surgery might influence tumor growth.
Second, even those patients with a “relatively long” interval until local failure might have had a large number of cancer cells remaining following initial surgery. If this was the case, the observed times to local failure may underestimate the age of the cancer at diagnosis. As shown in Figure 1, the time to local failure will decrease wth increasing degrees of residual local tumor.
Third, patients with a prior diagnosis of cancer are often agressively monitored for a local recurrence (eg, with serial computed tomography scans) and might therefore present with a relatively small local/regional tumor recurrence. On the other hand, it is often difficult to detect a local recurrence on imaging since post-operative changes often limit the sensitivity of imaging. Similarly, there might have been inter-physician differences in the frequency of follow-up evaluations, and inter-patient variations in the propensity to seek medical attention, which might have influenced the reported pace of local failure. Nevertheless, the logarithmic nature of tumor growth would suggest that these effects are relatively modest. Furthermore, the preferential use of data from prospective studies was intended to minimize these variations. However, there appeared to be no systematic differences between the data from the prospective studies and those from retrospective studies with regard to the pace of the recurrences. For example, the absolute rates of reported failures were somewhat higher in the prospective series than in the retrospective series (Figures 3A and 4A); however, the pace of recurrences was similar in the prospective and retrospective series (Figures 3B and 4B). Thus, combining the data from the prospective and the retrospective series may be reasonable
Fourth, two of the studies reported local-regional recurrence, rather than “local only” recurrences. Still, the LRF data series for Forrest 1996 and Saynak 2009 used in Figures 2A, 2B, 3A, and 3B fall within the highest and lowest “local failure only” curves. Thus, the data from these studies appear very similar to data from studies that reported specifically local failures.
The information presented regarding the pace of local failure is likely not particularly relevant to treatment decisions. However, it might be helpful for patients to understand the natural history of their cancer. Patients are often very anxious to start their treatments as soon as possible. While this is understandable, the new information regarding the typical ages of cancers may help patients keep this time element in perspective.
The data presented here are from only three specific diseases and may not be applicable to other cancer types. A similar analysis could also be conducted of resected metastatic lesions. Their “time to failure” might also be indicative of their age, and one might be able to make some inferences regarding their “time of birth” relative to the treatment and diagnosis of the index primary lesion.
Conclusion
As an extension of Collins’ law, our graphs of local recurrence data suggest that the typical age of a cancer at diagnosis is approximately 5 to 6 years for breast cancer, and 3 to 4 years for lung cancer and rectal cancer.
Financial Disclosure:Dr. Marks receives research funds from the National Institutes of Health and the Lance Armstrong Foundation, and he is an unpaid advisor to Siemens. The other authors have no significant financial interests or other relationships with the manufacturers of any products or providers of any service mentioned in this article.
Acknowledgement:Thanks to Dorothy Riguera for her assistance in the preparation of this manuscript.
References:
1. Morgan C, Park E, Cortes DE. Beliefs, knowledge, and behavior about cancer among urban Hispanic women. J Natl Cancer Inst Monogr. 1995:57-63.
2. Ruccione KS, Waskerwitz M, Buckley J, et al. What caused my child's cancer? Parents' responses to an epidemiology study of childhood cancer. J Pediatr Oncol Nurs. 1994;11:71-84.
3. Sussman N. Reactions of patients to the diagnosis and treatment of cancer. Anti-Cancer Drugs. 1995;6 Suppl 1:4-8.
4. Tomatis L, Melnick RL, Haseman J, et al. Alleged misconceptions' distort perceptions of environmental cancer risks. Faseb J. 2001;15:195-203.
5. Collins VP, Loeffler RK, Tivey H. Observations on growth rates of human tumors. Am J Roentgenol Radium Ther Nucl Med. 1956;76:988-1000.
6. Brown WD, Tavare CJ, Sobel EL, Gilles FH. The applicability of Collins' Law to childhood brain tumors and its usefulness as a predictor of survival. Neurosurg. 1995;36:1093-6.
7. Brown WD, Tavare CJ, Sobel EL, Gilles FH. Medulloblastoma and Collins' law: a critical review of the concept of a period of risk for tumor recurrence and patient survival. Neurosurg. 1995;36:691-7.
8. Latchaw JP, Hahn JF, Moylan DJ, et al. Medulloblastoma. Period of risk reviewed. Cancer. 1985;55:186-9.
9. Sala F, Colarusso E, Mazza C, et al. Brain tumors in children under 3 years of age. Recent experience (1987-1997) in 39 patients. Pediatr Neurosurg. 1999;31:16-26.
10. Sure U, Berghorn WJ, Bertalanffy H. Collins' law. Prediction of recurrence or cure in childhood medulloblastoma? Clin Neurol Neurosurg. 1997;99:113-6.
11. Paulino AC. Collins' law revisited: can we reliably predict the time to recurrence in common pediatric tumors? Pediatr Hematol Oncol. 2006;23:81-6.
12. Clark RM, Whelan T, Levine M, et al. Randomized clinical trial of breast irradiation following lumpectomy and axillary dissection for node-negative breast cancer: an update. Ontario Clinical Oncology Group. J Natl Cancer Inst. 1996;88:1659-64.
13. Fisher B, Anderson S, Bryant J, et al. Twenty-year follow-up of a randomized trial comparing total mastectomy, lumpectomy, and lumpectomy plus irradiation for the treatment of invasive breast cancer. N Engl J Med. 2002;347:1233-41.
14. Forrest AP, Stewart HJ, Everington D, et al. Randomised controlled trial of conservation therapy for breast cancer: 6-year analysis of the Scottish trial. Scottish Cancer Trials Breast Group. Lancet. 1996;348:708-13.
15. Liljegren G, Holmberg L, Bergh J, et al. 10-Year results after sector resection with or without postoperative radiotherapy for stage I breast cancer: a randomized trial. J Clin Oncol. 1999;17:2326-33.
16. Veronesi U, Marubini E, Mariani L, et al. Radiotherapy after breast-conserving surgery in small breast carcinoma: long-term results of a randomized trial. Ann Oncol. 2001;12:997-1003.
17. Ichinose Y, Kato H, Koike T, et al. Overall survival and local recurrence of 406 completely resected stage IIIa-N2 non-small cell lung cancer patients: questionnaire survey of the Japan Clinical Oncology Group to plan for clinical trials. Lung Cancer (Amsterdam, Netherlands). 2001;34:29-36.
18. Saynak M, Veeramachaneni NK, Hubbs JL, et al. Local failure after complete resection of “early-stage” non-small cell lung cancer: the potential role of post-operative radiation therapy. Int J Rad Oncol Biol Phys. 2009.
19. Stephens RJ, Girling DJ, Bleehen NM, et al. The role of post-operative radiotherapy in non-small-cell lung cancer: a multicentre randomised trial in patients with pathologically staged T1-2, N1-2, M0 disease. Medical Research Council Lung Cancer Working Party. Br J Cancer. 1996;74:632-9.
20. Varlotto JM, Recht A, Flickinger JC, et al. Factors associated with local and distant recurrence and survival in patients with resected non–small cell lung cancer. Cancer. 2009;115:1059-69.
21. Arbman G, Nilsson E, Hallbook O, Sjodahl R. Local recurrence following total mesorectal excision for rectal cancer. Br J Surg. 1996;83:375-9.
22. Bokey EL, Chapuis PH, Dent OF, et al. Surgical technique and survival in patients having a curative resection for colon cancer. Dis Colon Rectum. 2003;46:860-6.
23. Christoforidis E, Kanellos I, Tsachalis T, et al. Locally recurrent rectal cancer after curative resection. Techniques Coloproctol. 2004;8 Suppl 1:s132-4.
24. Gerard A, Buyse M, Nordlinger B, et al. Preoperative radiotherapy as adjuvant treatment in rectal cancer. Final results of a randomized study of the European Organization for Research and Treatment of Cancer (EORTC). Ann Surg. 1988;208:606-14.
25. Nesbakken A, Nygaard K, Westerheim O, et al. Local recurrence after mesorectal excision for rectal cancer. Eur J Surg Oncol. 2002;28:126-34.
26. Zaheer S, Pemberton JH, Farouk R, et al. Surgical treatment of adenocarcinoma of the rectum. Ann Surg. 1998;227:800-11.