(P148) The Use of Updated Dosimetric Guidelines and Independent Dose-Volume Histogram Analysis Improves Treatment Planning for Men Treated With Rapidarc Intensity-Modulated Radiation Therapy for Clinically Localized Prostate Cancer
We updated our evidence-based dosimetric guidelines for treatment of men with clinically localized prostate cancer and introduced independent dose-volume histogram (DVH) analysis using MatLab. In doing so, we sought to evaluate whether the interventions above would translate into improvement in dosimetric endpoints for organs at risk (OARs).
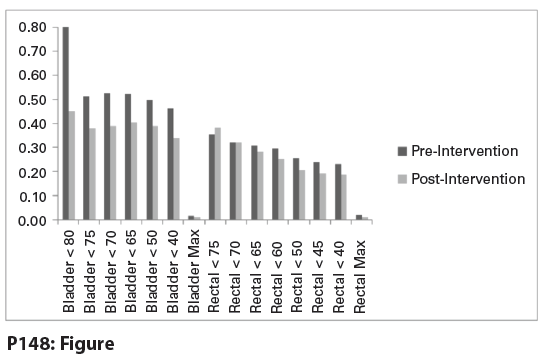
P148: Figure

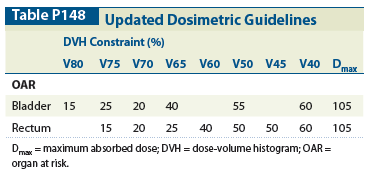
Table P148

J. Fields, L. Freiburg, B. Tom, PhD, D. Villines, MA, S. Yajnik, MD; Advocate Illinois Masonic Medical Center
Purpose: We updated our evidence-based dosimetric guidelines for treatment of men with clinically localized prostate cancer and introduced independent dose-volume histogram (DVH) analysis using MatLab. In doing so, we sought to evaluate whether the interventions above would translate into improvement in dosimetric endpoints for organs at risk (OARs).
Methods: An internal committee of radiation oncologists, physicists, and dosimetrists reviewed our site’s existing treatment guidelines and updated them based on current Radiation Therapy Oncology Group (RTOG) trials and scientific publications (see Table).
In order to efficiently assess which dose constraint objectives passed and which failed, a Matlab program was written to compare an input DVH file from the treatment planning software (Eclipse) with the dose constraint objectives. A report was then generated in Excel through Matlab software, highlighting those objectives that passed (displayed in green) and those that did not (red). Our center began using the updated guidelines and the MatLab program in April 2012. Currently, the independent DVH analysis for each patient is completed prior to plan approval.
All patients were treated with RapidArc intensity-modulated radiation therapy (IMRT), consisting of two full gantry rotations. The clinical target volume (CTV) for intermediate-risk patients was the prostate and seminal vesicles for the initial phase of treatment, followed by a cone-down to the prostate and proximal 1 cm of the seminal vesicles. The CTV for low-risk patients was the prostate and proximal 1 cm of the seminal vesicles for the full course of treatment. The planning target volume (PTV) was created by adding 8 mm circumferentially to the CTV except at the rectal interface, where 5 mm was added. All patients received 79.2 Gy in 1.8-Gy fractions with daily image guidance.
We retrospectively reviewed treatment plan data for 17 patients treated before and 9 after the interventions above. Groups were defined for analysis as those treated pre- and postintervention. DVH statistics were presented as means and standard deviations (SDs). Independent samples t-tests were used to determine group differences on bladder and rectal doses. The coefficient of variation was calculated for the differences between groups (ratio of the sample SD to the sample mean). This coefficient quantifies the extent of the variability in a sample, with higher values representing more variability.
Results: Our bladder V75Gy was reduced from 9.5% to 6% (P = .05), and rectum V70Gy and V50Gy were reduced from 12.8% and 29.0% to 9.4% and 22.5%, respectively (P < .05). Moreover, the coefficients of variation for each dosimetric endpoint, except for rectal V75Gy and V70Gy, were higher preintervention compared with patients treated postimplementation of updated guidelines/MatLab (see Figure).
Conclusion: Updating our dosimetric guidelines and using independent DVH analysis with MatLab reduced the dose to OARs, as indexed by several key DVH endpoints. In addition, the intervention described above resulted in treatment plans with less variability of dose delivered to OARs.